
Here's a number worth sitting with: as of early August 2026, the S&P 500's Shiller CAPE ratio sits around 41–42. In more than 140 years of data, that level has only been touched once before, at the peak of the dot-com bubble in December 1999. The index is trading at roughly two and a half times its long-run average valuation. If you own a broad index fund, a chunk of your retirement account is currently priced at levels the market has visited exactly one other time in its history.
That fact alone is a decent argument for learning fundamental analysis — the discipline of figuring out what a business is actually worth, separate from what the crowd happens to be paying for it this week.
What Fundamental Analysis Actually Means
Fundamental analysis is the practice of estimating a company's value by studying the business itself: its revenue, profit margins, debt load, cash generation, competitive position, and growth prospects. You're not asking "is this stock going up?" You're asking "if I bought this entire company outright, would the price make sense given what it actually earns and owns?"
That distinction matters more than it sounds. A lot of investing content blurs "the stock is doing well" with "the company is doing well," and those are not the same claim. A company can post record profits while its stock falls, because the stock was priced for even higher profits than it delivered. Fundamental analysis is the tool that separates the business from the ticker.
Fundamental vs. Technical Analysis: Two Different Questions
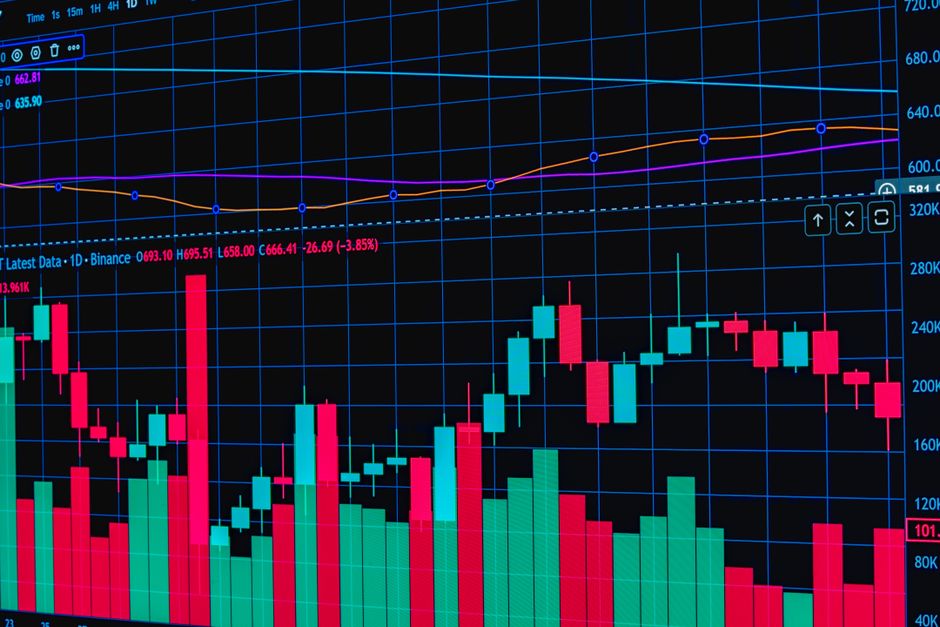
People often ask which is "better," fundamental or technical analysis, but they're not really competing answers to the same question. Technical analysis studies price and volume patterns to guess where a stock is headed next — it doesn't care whether the underlying company is profitable, only how the crowd has been trading it. Fundamental analysis ignores the chart entirely and asks what the business is worth on its own terms.
A trader holding a position for three days has little use for a company's five-year cash flow trend. Someone building a retirement portfolio has little use for a candlestick pattern. Neither camp is wrong — they're solving for different time horizons.
Price Is What You Pay, Value Is What You Get
This is where fundamental analysis earns its "framework" status, courtesy of Benjamin Graham, the economist whose ideas shaped how Warren Buffett and generations of professional investors think about markets. Graham's central insight, still taught in every CFA curriculum today, is deceptively simple: price and value are two different things, and the market conflates them constantly.
Graham described the market as a moody business partner — call him Mr. Market — who shows up every day offering to buy your shares or sell you his, at a price driven by whatever mood he's in that morning. Some days he's euphoric and overpays wildly. Some days he's despondent and practically gives shares away. Your job isn't to predict his mood. It's to know roughly what the business is worth, so you can take advantage when his price and your estimate diverge sharply.
The practical extension of this is the "margin of safety" — buying at a price meaningfully below your estimate of intrinsic value, so that even if your estimate is a bit wrong, you're not badly exposed. Think of it less as a formula and more as a habit of humility: you will misjudge some companies, so build in room for being wrong.
Reading the Numbers That Actually Matter
In practice, fundamental analysis leans on a handful of recurring metrics. The price-to-earnings ratio tells you how many years of current profit you're paying for upfront. Price-to-book compares the stock price to the company's net assets. Return on equity shows how efficiently a company turns shareholder money into profit. Free cash flow — the money left over after running and reinvesting in the business — matters more than reported earnings, because earnings can be shaped by accounting choices in ways cash flow can't.
Picture two companies both trading at $50 a share. Company A earns $5 per share, carries manageable debt, and has grown free cash flow steadily for five years — a P/E of 10. Company B earns $1 per share, is burning cash, and is betting on a product that hasn't shipped yet — a P/E of 50. The chart for both stocks might look identical over the past month. The businesses behind them are not remotely comparable, and that's the whole point of doing this work instead of skipping it.
Does Fundamental Analysis Actually Beat the Market?
Here's the uncomfortable part, and it's worth asking directly: if fundamental analysis works, why do most professionals who use it full-time still lose to a plain index fund? According to S&P Dow Jones Indices' year-end 2025 SPIVA U.S. Scorecard, 79% of actively managed large-cap U.S. equity funds underperformed the S&P 500 that year, and over the trailing 20 years roughly 92% of domestic active funds lagged their benchmarks. Over 15-year stretches, not one of 22 U.S. equity fund categories had a majority of active managers beat their index.
That's not a knock against fundamental analysis so much as evidence that markets are hard to beat even when you're doing the homework — competition among analysts is fierce, information spreads fast, and being right about a business doesn't guarantee you were the first or cheapest to be right. Fundamental analysis is better understood as a tool for not overpaying and not panicking, not a guaranteed edge over everyone else holding the same spreadsheet.
Where This Approach Falls Apart
The most common failure is the value trap: a stock that looks cheap on every metric because the business is genuinely deteriorating, not because the market is mispricing it. Cheap and declining is not the same as cheap and mispriced. Another is over-trusting reported earnings without checking cash flow — companies have legal room to flatter their numbers, and free cash flow is harder to fake. And a subtler one: doing rigorous analysis on a good company, then paying whatever the market asks anyway because the story felt too compelling to wait for a better price. Margin of safety only works if you actually wait for the margin.
Who This Is Actually For
If your holding period is measured in years, not days, and you'd rather understand what you own than react to what it's doing, this is your toolkit. Gallup's 2026 data shows 58% of U.S. adults now own stock, mostly through retirement accounts they rarely look at closely — which means most shareholders are, functionally, buying without asking whether the price makes sense. You don't need to model every holding line by line. But before your next purchase, pull up the P/E, check whether cash flow supports the story, and ask what you're actually paying for. At current valuations, that habit is worth more than usual.