
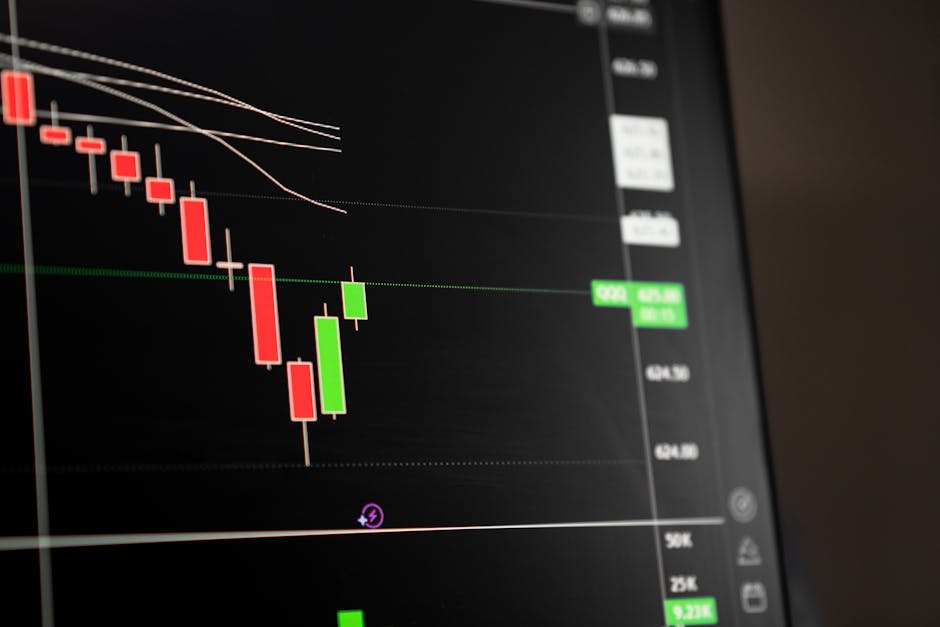
The Cboe Volatility Index, the market's best-known fear gauge, sat around 18 to 19 in late July 2026 — close to its long-run median, the kind of reading that usually says "nothing to see here." Yet by that point in the year, the S&P 500 had already logged eight separate weeks where the gap between its best- and worst-performing sectors hit double digits. According to data compiled by Sevens Report and reported by Bloomberg, the only other times this century that happened this early in the year were 2000, 2001, and 2009 — three periods nobody remembers fondly.
That contradiction is the whole reason financial market analysis exists. A single number can tell you the market is fine while the machinery underneath is anything but. If you only look at the headline index, you miss the story. If you know how to read volume, valuation, sector rotation, and sentiment together, you catch it early.
So what is financial market analysis, really? It's the practice of evaluating securities, sectors, or entire markets to judge whether current prices reflect what's actually happening — and where they're likely headed next. It isn't a single tool. It's a set of overlapping lenses, and which one you reach for depends on the question you're actually trying to answer.
Fundamental vs. Technical: Two Different Questions, Not Rival Religions
Fundamental analysis asks: what is this actually worth? It digs into earnings, cash flow, debt levels, competitive position, and macro conditions to estimate a company's intrinsic value, then compares that to its market price. Technical analysis asks a narrower, more tactical question: given how price and volume have behaved, where is this likely to go in the near term? It leans on charts, momentum, and historical patterns rather than balance sheets.
You've probably heard these framed as opposites — value investors versus chart-watchers, patience versus speculation. In practice, plenty of serious investors use both, and 2026 has made that hybrid approach more relevant than ever. With interest rates still elevated, debt-heavy companies are carrying real interest-cost risk, and several major bank outlooks this year — from Bank of America to J.P. Morgan to Wells Fargo — have converged on the same idea: markets in 2026 are being driven more by fundamentals than by pure momentum or hype, and higher-quality balance sheets are the ones best positioned to absorb policy shocks. That's a fundamental-analysis argument. But knowing when to act on it, especially in a market prone to the kind of sharp sector rotations described above, is where technical signals earn their keep.
Ask yourself which question you're actually trying to answer before you pick a tool. Are you deciding whether to own a company for the next five years, or whether to buy it this week? Those are different jobs, and they call for different kinds of evidence.
The Bias Quietly Distorting How You Read the Market
Here's the concept worth carrying with you: recency bias — the tendency to weight recent events far more heavily than the historical record justifies. It's not exotic behavioral finance jargon; it's the simple, human habit of assuming that whatever just happened is what's about to happen again.
It matters here because a VIX reading of 18 feels reassuring precisely because recent weeks have felt calm. But recency bias is exactly what makes headline-level volatility measures deceptive during periods of hidden sector dispersion — the calm the index is showing you is an average, and averages hide the tails. Investors who anchor on "the market has been fine lately" are the ones most likely to miss a rotation until it's already hurting their portfolio. Analysis, done properly, is partly a discipline for correcting this bias: forcing yourself to look past what just happened and ask what the broader distribution of outcomes actually looks like.
Try this yourself for a second: think about the last few months of your own portfolio. Are you holding a position mainly because of what it's done recently, or because you've actually re-checked the reasoning behind it?
Retail Investors Are Leaning on AI — But That Cuts Both Ways
One of the bigger shifts in how ordinary investors approach analysis in 2026 is the rise of AI-assisted tools. A March 2026 survey of nearly a thousand U.S. retail investors, conducted by Investing.com, found that close to two out of three now use some form of AI to help shape their investment decisions, and a notable share credited it with improving their results. Separately, eToro's Retail Investor Beat survey, fielded across multiple countries in May 2026, pointed to something similar: retail investors are paying closer attention to valuations and fundamentals when they deploy capital during downturns — even while many of them still back AI-related stocks for the long run, despite naming tech as the market's most overvalued sector right now.
That's a genuinely useful shift if it pushes people toward more disciplined, data-grounded decisions instead of chasing headlines. But it's also a trap if it becomes another form of recency bias — treating an AI-generated summary as gospel simply because it sounds confident and arrived quickly. A model can process financial statements faster than you can, but it can't tell you what your own risk tolerance is, and it won't necessarily flag when its training data is stale or when a source is thin.
Where This Trips People Up
Retail investors don't usually fail at market analysis because they lack access to information — access has never been easier. They fail because of a handful of predictable habits: treating one data point (a single earnings beat, one bullish chart pattern) as the whole story; confusing conviction with correctness; and abandoning a fundamentally sound thesis the moment short-term price action disagrees with it. Financial literacy research backs this up at scale. The OECD/INFE's most recent international survey, covering 39 economies, found that people who score higher on financial literacy consistently report greater financial resilience and well-being than those who score lower — literacy isn't a nice-to-have, it's a measurable buffer against exactly the kind of panic-driven mistakes that undo good analysis.
Picture a simple case: an investor sees a stock fall 15% in a week on no company-specific news, purely because capital rotated out of its sector into another. Someone reading price action alone might read that as a sell signal. Someone who checked the fundamentals first — debt levels stable, earnings guidance unchanged, no red flags in the filings — would recognize sector-level noise for what it is, and might even see the drop as an opportunity rather than a warning.
Where to Actually Start
You don't need a Bloomberg terminal to analyze markets seriously. Start narrow: pick one or two companies or sectors you already understand, read their actual earnings releases instead of secondhand summaries, and track how their prices move relative to a benchmark over a few months before you draw conclusions. Layer in a couple of technical basics — moving averages, volume trends — once you're comfortable with the fundamentals, not before.
The market rewarding patience and punishing overreaction isn't a platitude in 2026 — it's what the sector-dispersion data is quietly showing right now. The index looking calm doesn't mean it's safe to stop paying attention underneath.
Quick Answers
Is technical or fundamental analysis better for beginners? Neither is objectively "better" — fundamental analysis is generally easier to learn first because it maps to concepts most people already understand (profit, debt, growth), while technical analysis requires more chart-reading practice before the patterns become intuitive.
How often should I re-analyze my positions? There's no universal rule, but reviewing fundamentals quarterly (alongside earnings releases) and checking price action weekly or monthly, depending on your time horizon, is a reasonable baseline for most long-term investors.
Can AI tools replace market analysis entirely? No — they can accelerate research and surface patterns faster than manual review, but they don't carry accountability for your specific risk tolerance or goals, and their outputs are only as reliable as the data and reasoning behind them.